Up: Bifurcation
One-Dimensional Dynamical Systems
Part 5: Bifurcation
Orbit diagram
Now that you learned that a function can undergo bifurcations that
change the qualitative dynamics, it is interesting to see how the
dynamics really depends on the parameter. We want to visualize the
relation between the dynamics of the Logistic map and the parameter
 .
.

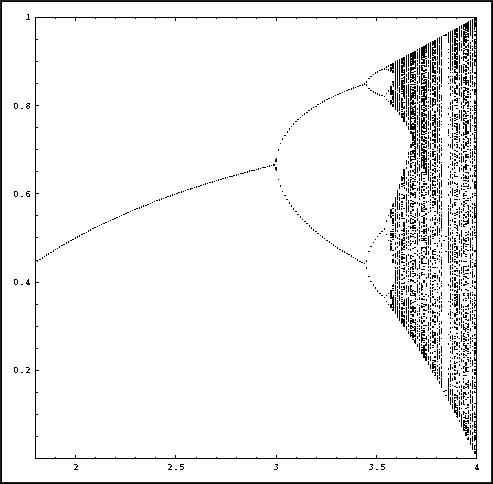
An enlargement of the orbit diagram for the Logistic family.
The picture above is called the orbit diagram for the Logistic family.
It shows the eventual behavior of bounded orbits (that is, the orbits
that do not just go off to infinity), as a function of the
parameter. Question 3 from the
homework asked you to make a partial
sketch of this diagram. The values on the horizontal axis correspond
to parameter values for
 . The vertical
values correspond to (eventual) iterates of an arbitrary point
x0. If the eventual behavior of
x0 is periodic, these iterates will repeat each
other, and only a small number of points will be shown. For example,
for
  smaller
than 3 there is only a single point for each value of
 .
This means that the orbit of x0 goes to an
(attracting) fixed point of the Logistic map.
Let the computer draw the orbit diagram and answer the questions
below; see the instructions for the
Macintosh or
other machines.
- At
 = 1 the
curve suddenly turns away from the horizontal axis. What has happened?
- Somewhere between 2 and 3.1, the orbit diagram curve splits into
two branches. Why are there two branches now? What do they correspond
to? (Hint: What was the eventual behavior of points in this region?)
- Investigate further bifurcations as
 increases.
Describe the sequence of bifurcations. In other words, how does the
period of the attracting set change at each bifurcation?
Up: Bifurcation
![[HOME]](/pix/home.gif) The Geometry Center Home Page
The Geometry Center Home Page
Written by Hinke Osinga
Comments to:
webmaster@geom.umn.edu
Created: Apr 6 1998 ---
Last modified: Thu Apr 9 14:22:26 1998
 .
.

![[HOME]](/pix/home.gif) The Geometry Center Home Page
The Geometry Center Home Page