Up: Linear and Nonlinear Behavior
One-Dimensional Dynamical Systems
Part 4: Linear and Nonlinear Behavior
Instructions for the Macintosh: Graphs of higher iterates
The software Chaos and Dynamics can be found in the apple-menu, under
'Math Apps'. Go to 'Devaney's Chaos Lab' and load
'Lab 2-Plot and Analyze'.
Instructions to graph higher iterates
- Push the Add Graph button, marked with a '+'. Now pick a
value for
 .
.
- Push the Add Graph button again, and change the value in
the Iterate column from 1 to 2. (Make sure that both graphs
correspond to the same
 .)
.)
- To get a closer look at a region, use the mouse to select a
region, and click on the Magnify button.
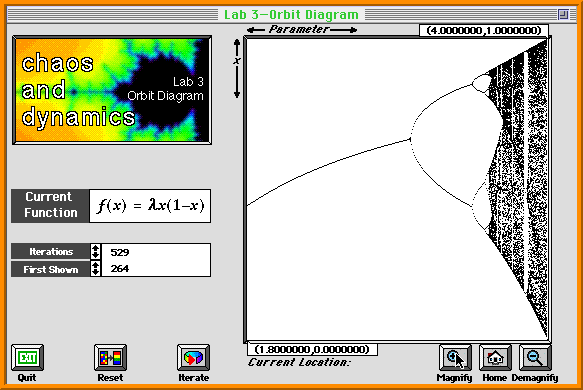
Instructions for the Macintosh: Orbit Diagram
The software Chaos and Dynamics can be found in the apple-menu, under
'Math Apps'. Go to 'Devaney's Chaos Lab' and load
'Lab 3-Orbit Diagram'.

An enlargement of the orbit diagram for the Logistic family.
How to Study the Orbit Diagram
- To start the computation, click on the Iterate button.
The program begins by iterating an arbitrary point
x0 as many times as specified in the
Iterations box. However, iterates are displayed only after the
number of iterates in the First Shown box. Therefore, the
transients are not shown in the picture.
- To get a picture that reflects the eventual attracting behavior
more accurately, increase the numbers in the First Shown and
Iterations boxes.
- To look at a particular area, select the area with your mouse, and
click on the Magnify button. Notice that the numbers in the
First Shown and Iterations boxes are increased
automatically. You can still increase these numbers even more, if you
like.
Up: Linear and Nonlinear Behavior
![[HOME]](/pix/home.gif) The Geometry Center Home Page
The Geometry Center Home Page
Written by Hinke Osinga
Comments to:
webmaster@geom.umn.edu
Created: Apr 3 1998 ---
Last modified: Wed Apr 8 19:24:53 1998
 .
.
 .)
.)
 .
.
 .)
.)

![[HOME]](/pix/home.gif) The Geometry Center Home Page
The Geometry Center Home Page