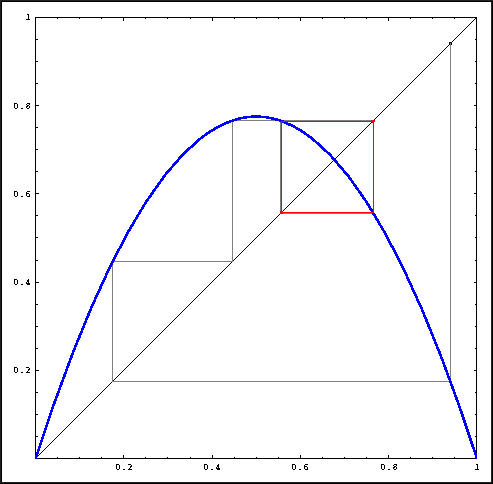
Visualizing an orbit with graphical iteration for the Logistic map.
One-Dimensional Dynamical Systems
Part 3: Iteration
Graphical iteration
Another, generally more preferred, way of visualizing orbits is based
on the graph of the function that represents the dynamical system. It
starts by showing the graph of a function y = f(x)
and the graph of the identity function y = x. Suppose we have
an orbit:
We can visualize this orbit in the (x, y)-plane by drawing lines between points on the graph of f and points on the line y = x. The following sequence represents the same orbit as above:
Points of the form (xn, xn) are on the graph of the identity function, that is, on the line y = x. The points (xn, xn+1) = (xn, f(xn)) are on the graph of f.

Visualizing an orbit with graphical iteration for the Logistic map.
Starting with (x0, x0) on the diagonal, draw a vertical line to the graph of f. Recall that f(x0) is the next point in the orbit of x0. Next, draw a horizontal line from (x0, f(x0)) to the diagonal. This way, we have repositioned our point so that a vertical line from this new position will give us f(f(x0)). This procedure, called graphical iteration, makes visualization easier and provides a geometric shortcut; you can even sketch an orbit instead of computing it.
Graphical iteration on the computer can be done with the following software. If you are using a Macintosh computer, follow the instructions for the software Chaos and Dynamics. On the other machines, you should follow the instructions for using Mathematica.
 . For each
 , which point
is attracting? Are there the same number of attracting points for
every
  ?
?
 between 0 and 3.5, investigate the eventual behavior of
x0 = 0.1. In Devaney's Chaos Lab #2 you can push
the Transient button to see what the eventual behavior is; in
the other cases, the eventual behavior is shown in red.
 on the
horizontal axis and x on the vertical axis. For each
 value that you
checked, place a dot at the x values that are part of the
eventual behavior of x0 = 0.1. If you checked the
eventual behavior for enough
 values, you
should be able to sketch the curves connecting the dots, showing the
continuous dependence on
 . Do not go
beyond
  = 3.5.
![[HOME]](/pix/home.gif) The Geometry Center Home Page
The Geometry Center Home Page
Written by Hinke Osinga
Comments to:
webmaster@geom.umn.edu
Created: Apr 1 1998 ---
Last modified: Thu Apr 9 13:45:03 1998