Group Homework - One-Dimensional Dynamical Systems
Table of Contents
Warm Up Questions
Questions (The Real Thing)
One-Day Lesson Using Technology
Lesson
- The graph of f is simply a straight line. Draw the graphs for lamda = 0.1, 0.3, 1, 2, and 5. Explain for each lamda what the long term behavior of the system is for arbitrary x. What happens for x = 0? What happens for lamda = 1?
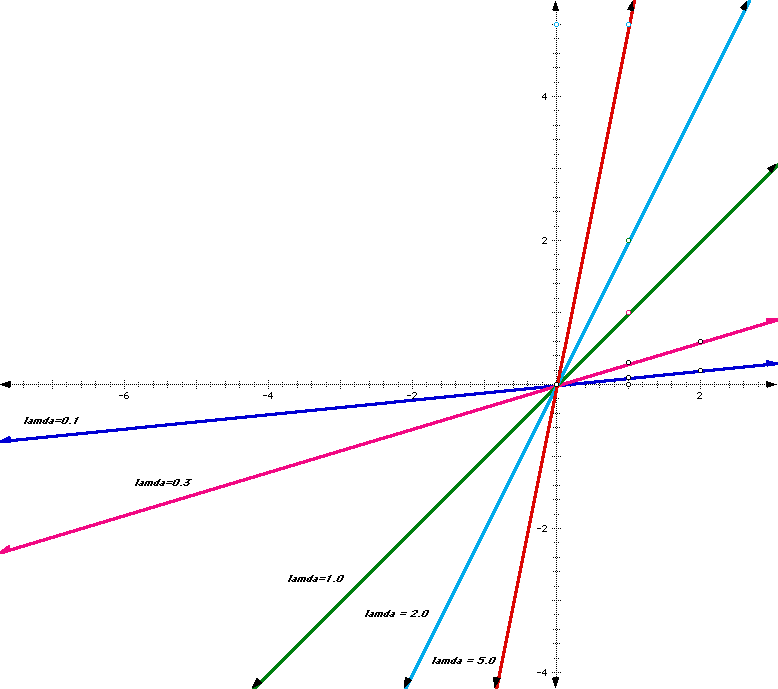
For lamda=0.1 and lamda=0.3, the squirrel population declines at a rate of 1/10 and 1/3 times that of the previous year per year, respectively. This means that the squirrel population decreases from that of the previous year approaching extinction. For lamda=1, the squirrel population remains constant from year to year maintaining its population. For lamda=2 and lamda=5, the squirrel population grows at a rate of 2 and 5 times that of the previous year per year, respectively causing a squirrel population explosion. In otherwords, growth and decay are exponential. When x=0, there can be no growth or decay, since we have no squirrels.
Now look at the slope of each graph. Do you see a relation between the long term behavior of the system and the slope of its graph?
The slope of 1 (or lamda=1) is the dividing line separating growth from decay. Slopes greater than 1 cause population growth to eventual overpopulation; Slopes less than 1 cause population decay and eventual extinction.
- For negative lamda the graph of f is still a straight line. Draw the graphs for lamda=-3, -1.8, -1, -0.5, and -0.2. For each lamda, describe the long term behavior, and explain the difference in behavior compared to positive lamda. Formulate the relation between the long term behavior of the system and the slope of its graph, for both positive and negative slopes.
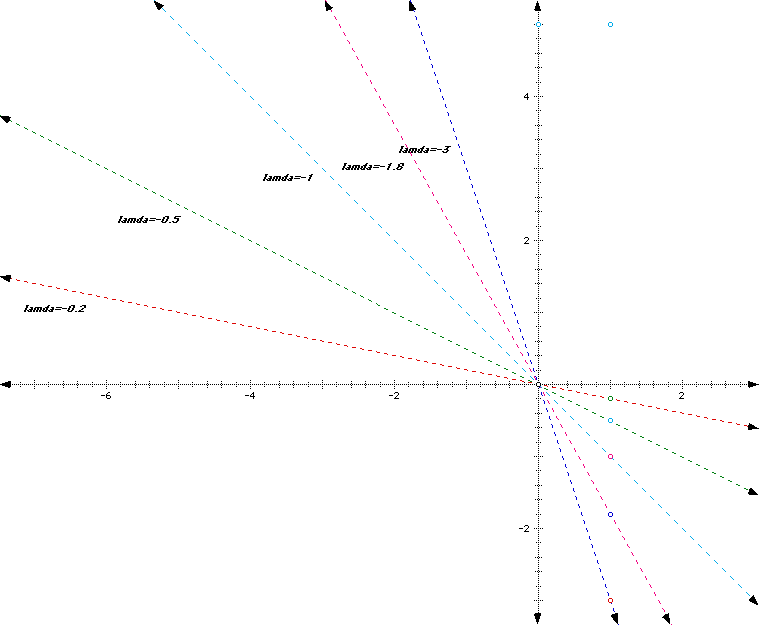
For negative lamdas, we can not discuss squirrels. Instead, we will approach it from the purely mathematical point of view. The behavior of the function for values of lamda less than -1 is negatively exponential and approaches negative infinity. For lamda=-1, the function is merely a mirror of the behavior of lamda=1 about the x-axis. For values of lamda greater than -1 and less than zero, we see that the function appoaches zero.
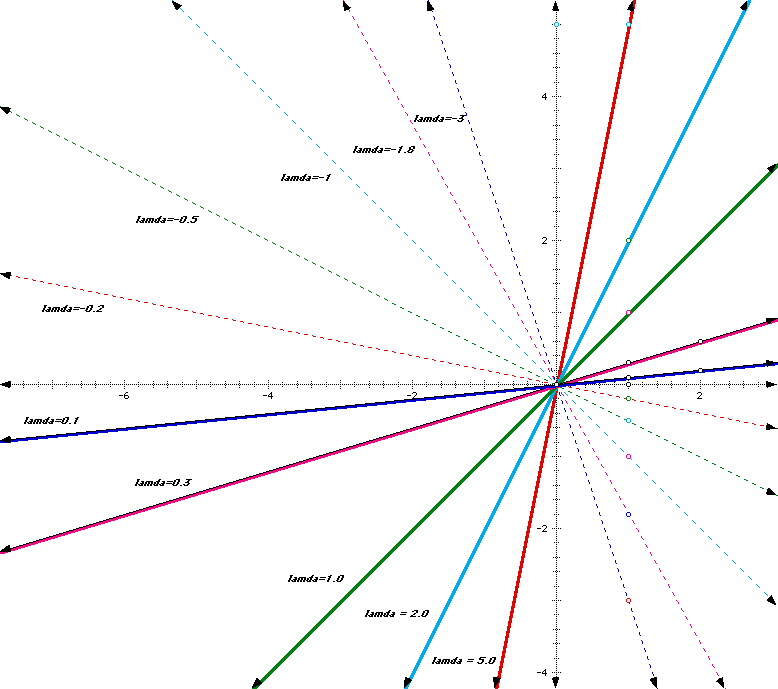
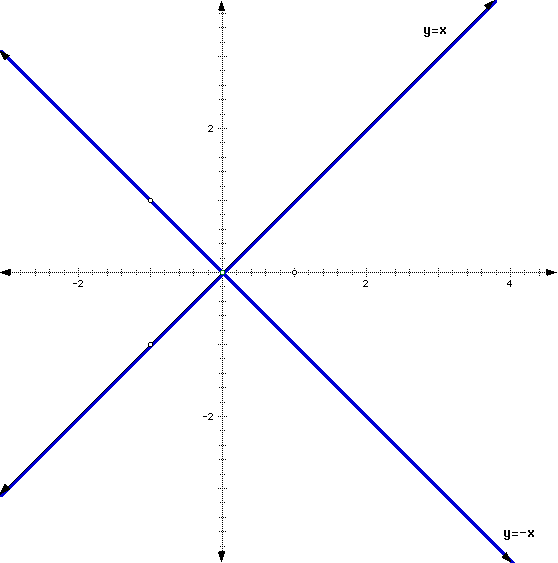
This can be related to the positive lamdas by simply noting that the relations of going to infinity for lamda greater than 1 mirrors for lamda less than negative 1. Likewise, the behavior of lamda greater than zero and less than 1 are also mirrored about the x-axis, thus creating two regions. One region approaches infinity and hte other approaches zero. The regions are divided by the lines y=x and y=-x.
- In the above exercises you have found two special lines, corresponding to two special linear systems, namely f(x)=x and f(x)=-x. Draw the graphs of these two functions. In the same picture sketch the graph of a nonlinear function which is such that iterates of this function go to infinity for all x not equal to zero.
We have provided the basic graph. The additional function graph will be handed in on paper.
- Suppose we have a dynamical system given by the square root function on your calculator. Type in any number and calculate its square root. Take the square root of the result. Take the square root again and so on. Give a full description of the dynamics, similar to what was done for the squirrel model. In particular, look for values of x that do not change when taking the square root. Only consider x greater than or equal to zero.
Draw the graph of the square root function, together with the two special lines y=x and y=-x. What is special about the points where the graph of the square root function intersects one of the two lines?
Taking the square root repeatedly shows us that f(x) approaches one as x increases from zero to one and approaches infinity for values of x greater than 1. At x=1, there is no change in the value of f(x) when repeated square roots are taken.
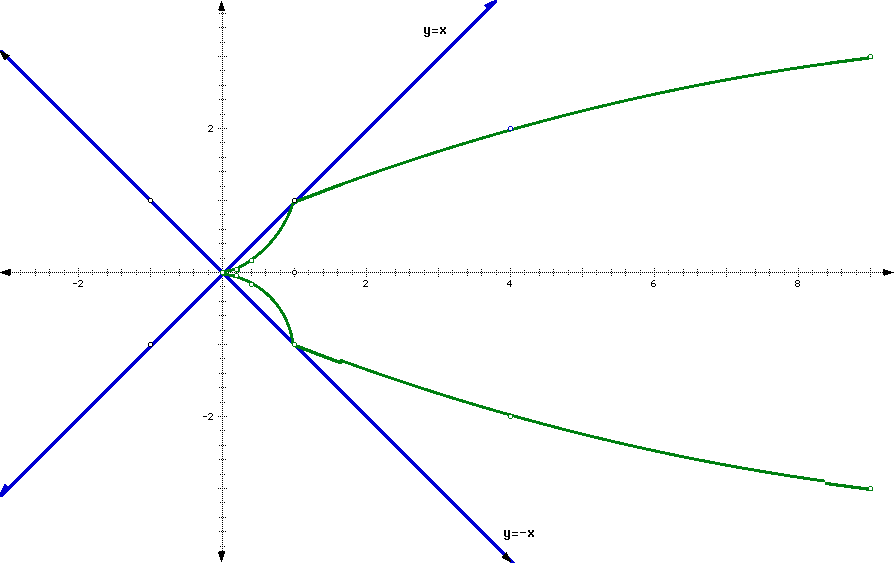
Note that the function y=sqrt(x) only intersects y=x and y=-x at x=1, the point where repeated square roots always yield y=1.
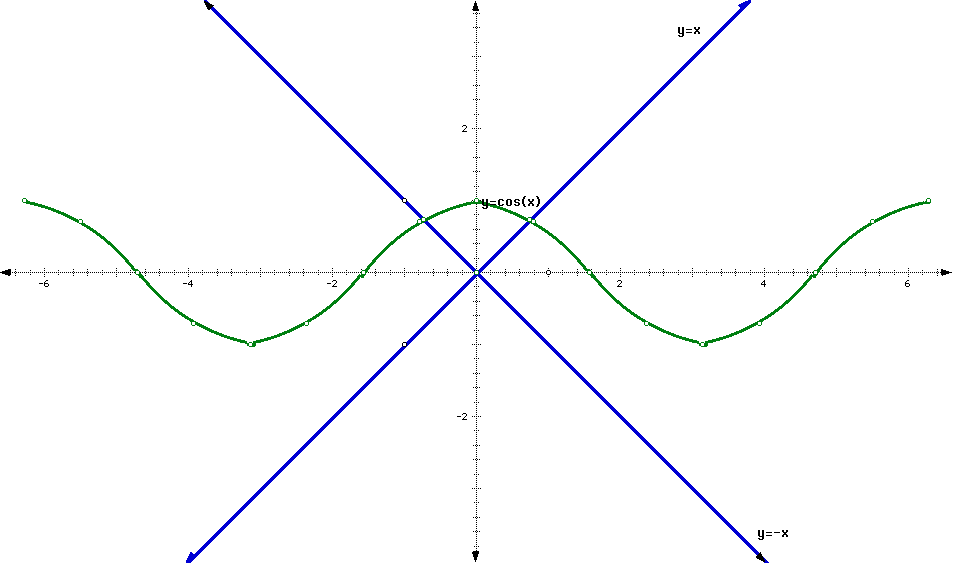
- Give a description of the dynamics for a dynamical system given by a cosine button, where x is given in radians. Draw a graph of the cosine function for x given in radians. Also draw the special lines y=x and y=-x. Describe what is special about the points on the intersection of the graph of the cosine function and these two lines.
The graph of f(x)=cos(x) where x is given in radians is bounded by the lines y=1 and y=-1. The points of intersection between y=cos(x) and y=(plus or minus)x are at x=(plus or minus)0.99984774, the point where (plus or minus)x=cos(x).
- What are the fixed points of f(x)=x^2? What is the relation between the fixed points of the square function and the intersection points of the graph of the square function with special lines y=x and y=-x?
The fixed points of y=x^2 are at x=0 and x=1. These points are the same points as the intersections of y=x^2 with lines y=x and y=-x.
- Consider the square function on your calculator. Pick a point "near" (distance less than 0.1 is near enough) a fixed point. Keep iterating "pushing the squaring button" until you see a pattern for the long term behavior. Try again with other numbers near each of the fixed points. Write down what happens for each choice. Does it matter if the number you pick is less than or greater than the fixed point?
For x=0.1, with iteration, we see that f(x) approaches 0. For x=-0.1, with iteration, once again, f(x) approaches 0. For x=0.9, with iteration, not surprisingly, f(x) approaches 0, but for x=1.1, with iteration, f(x) approaches positive infinity. Values of the point between one and negative one will converge to zero. All other values of the point will diverge to positive infinity.
- Which of the fixed points for the square function are attracting? Which are repelling?
The fixed point x=0 is attracting, since points near it converge to it. The fixed point x=1 is repelling, since points near it diverge away from it.
- Use the Java Applet Iterates versus time for the Logistic map to see how the plot changes as lamda varies. Describe what you see. Note that always the iterates of x0=0.5 are taken. Can you find values for x0 greater than or equal to zero for which the orbit behaves different from the orbit of x0=0.5.
As lamda increases from 1 to 4, f(x) changesfrom a convergence to 0 to oscillations between two values of y and eventually chaos between 0 and 1. At x0=0, the function is the straight line y=0. At x0=1, the function is the straight line y=1.
- Use the Java Applet Iteration of the Logistic Map to see how the dynamics close to the (positive) fixed point depend on the parameter lamda. When you start the applet, this fixed point is attracting.
Is it attracting for all x0?
No. The attracting/repelling/neutral characteristics of the function are controlled by lamda.
Is it attracting for all lamda? If not, what happens right after it stopped being attracting?
No. Right after it stops attracting, it repells and then becomes neutral approaching chaos.
- Draw a diagram with lamda on the horizontal axis and x on the vertical axis. For each lamda value that you checked, place a dot at the x values that are part of the eventual behavior of x0 =0.1, If you checked the eventual behavior for enough lamda values, you should be able to sketch the curves connecting the dots, showing the continuous dependence on lamda. Do not go beyond lamda=3.5.
This will be hand-sketched and turned into your mailbox.
11. Check that for f(x)=3.2x(1-x), the points x=0 and x=11/16 are fixed points. Check that x=(21+sqrt(21))/32 and x=(21-sqrt(21))/32 are period-2 points.
f(0)=3.2*0*(1-0)=0
f(11/16)=3.2*11/16*(1-11/16)=11/16
Therefore, x=0 and x=11/16 are fixed points for f(x).
x=(21+sqrt(21))/32=.799455
f((21+sqrt(21))/32)=3.2*(21+sqrt(21))/32*(1-(21+sqrt(21))/32)=0.5130445
f(f(21+sqrt(21))/32)=(f(0.5130445)=3.2*0.5130445*(1-0.5130445)=.799455
x=(21-sqrt(21))/32=0.5130445
f((21-sqrt(21))/32)=3.2*(21-sqrt(21))/32*(1-(21-sqrt(21))/32)=.799455
f(f(21+sqrt(21))/32)=(f(0.5130445)=3.2*0.5130445*(1-0.5130445)=.5130445
So, x=(21+sqrt(21))/32) and x=(21-sqrt(21))/32 are period-2 points.
13. Graphically determine the number of period-2 points for functions in the Logistic family at lamda=2, 3.1, and 3.5. Remember to exclude fixed points when you count intersections. Are they attracting?
The graph with lamda=2 has no period-2 points.
The graph with lamda=3.1 has a period-2 point at x=.323. It is repelling.
The graph with lamda=3.5 has a period-2 point at x=.283. It is repelling.
16. Using the techniques from the part on Eventual behavior, draw a qualitative diagram for lamda=3.5. What is the period of the attracting orbit here? Indicate in which order the points in the orbit occur.
The graph will be presented by hand in your box. Period-4 is the period of the attracting orbit. The order of the attracting orbit here is x=.38 -> x=.83 -> x=.51 -> x=.87 -> x=.38.
18. Recall that in order to find period-2 points, you graphed the second iterate of the map. Can you find a relationship between the slope of the graph of the second iterate of the function and whether the period-2 points are attracting, repelling, or neutral?
The period-2 points attract to the points where the slope of the second iterate is 0. Points of neutrality occur where the second iterate curve crosses the line y=x. Attracting points lie in the area in which the second iterate slope is between -1 and 1. All other points are repelling.
19. Describe geometrically how your relationship (between the slope of the graph of the second iterate of the function and whether the period-2 points are attracting, repelling, or neutral) might generalize to period-n points.
The points of neutrality of the second iteration will always be intersection points of all period-n iterations where n is not 1.
20. Recall that p is a fixed point of f if f(p)=p. Verify that the Logistic family f(x)=lamdax(1-x) has fixed points x=0 and x=(lamda-1)/lamda.
Compute the slope of the graph of the Logistic map at the fixed point 0 in terms of lamda. What is the slope for the other fixed point?
f(0)=lamda*0*(1-0)=0
f((lamda-1)/lamda)=lamda*(lamda-1)/lamda*(1-(lamda-1)/lamda)
=(lamda-1)((lamda-(lamda-1)/lamda1))
=(lamda-1)/lamda
Therefore, x=0 and x=(lamda-1)/lamda are fixed points for f(x).
f'(x)=lamda-2*lamda*x
slope = f'(x)
f'(0)=lamda-2*lamda(0)=lamda
The slope of fixed point 0 is lamda.
f'((lamda-1)/lamda)=lamda-2*lamda((lamda-1)/lamda)
=lamda-2(lamda-1)
=1-lamda
The slope of fixed point (lamda-1)/lamda is 1-lamda.
21. For what values of lamda are the fixed points of the Logistic family attracting? Repelling? Neutral? Test your values using the computer.
Values of lamda between 0 and 2 gives attracting fixed points. At lamda=2 and lamda=0, the fixed point is neutral, and at values of lamda greater than 2, the points repel.
23. At exactly what lamda value between 1.5 and 3.1 does a bifurcation occur? Explain why you know this value is exact.
The exact lamda value at which bifurcation occurs is 2.0. We see this by solving for lamda, since we know that at slopes of -1 and 1 the fixed point is neutral.
-1 is less than or equal to (1- lamda) is less than or equal to 1.
-2 is less than or equal to (- lamda) is less than or equal to 0.
Then, 0 is less than or equal to (lamda) is less than or equal to 2. This indicates that the exact lamda value of bifurcation (where the graph switches from attracting to repelling) is 2.
24. Consider the orbit diagram for the Logistic map. At lamda =1 the curve suddenly turns away from the horizontal axis. What as happened?
There is only one fixed point (and it is an attracting fixed point).
26. Investigate further bifurcations as lamda increases. Describe the sequence of bifurcations. In other words, how does the period of attracting set change at each bifurcation?
The bifurcations always double, and therefore the period always doubles at a bifurcation.
27. Investigate the behavior of the iterates for parameters in a small interval aroud lamda =-0.75. Discuss the bifurcation that occurs in the Quadratic family for lamda =-0.75.
At lamda=-0.75 a bifurcation occurs, and we see a shift from attracting (for values larger than lamda=-0.75) to repelling (for values smaller than lamda=-0.75).
29. Compare the orbit diagrams for the Logistic family f(x)=lamda*x(1-x) and for the Quadratic family f(x)=x^2+lamda. Do you see any similarities? Discuss them and point out the differences.
The orbit diagrams are the same shape, but that of f(x)=x^2+lamda is a rotation of 180 degrees of the other orbit diagram.
What is the range of lamda values in the diagram for the Logistic family?
The lamda values are greater than or equal to 0.
What is the range of lamda values in the diagram for the Quadratic family?
The lamda values are less than or equal to 0.
For lamda=4, the graph of the Logistic map is special. The interval [0,1/2] is mapped entirely onto [0,1] twice. Notice that this is not true for smaller (positive) values of lamda. Find the value for lamda such that the graph of f(x)=x^2+lamda covers the interval [-2,2] exactly twice, as described above for the Logistic map.
This occurs at lamda=-2.0.


