In order to properly model the heartbeat cycle we must assume that the mathematical equations be drawn from a particular class of equations that will adequately describe the fundamental features of heart physiology. In our case the class from which we choose must have two degrees of freedom. In order to assist with the development o f this model we will use the equations:
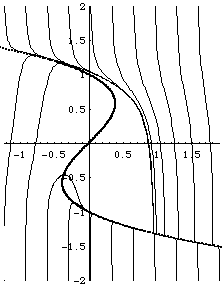
For now, consider ê to be a small parameter dependent on the time scale. Later, you will be asked to find the function of epsilon, in the context of the heartbeat. The purpose of u is to provide for a limit cycle. Without u, our phase portrait would simply consist of one attracting equilibrium, (b1,x1). This would mean that the heart we examine would simply come to one complete contraction and remain frozen at th at state. That is, the heart would not continue beating. An example of such a phase portrait is provided below.

In this phase portrait and phase portraits which you will construct, b is plot ted on the horizontal axis, x on the vertical.
To help you understand the function of u, consider it to be a control parameter that instructs the heart when to beat and when to relax. When u=1, the heart is beating. When u=0 the heart is relaxing .
Another important biological concern is Starling's Law. This says that stretched muscle fibers beat more forcibly, but only to a point. Assume that some form of excitement causes your adrenaline to be injected into your bloodstream; the adrenaline causes the blood pressure to rise and forces the atria to pump more blood into the ventricles. Starling's Law indicates that stretched ventricles give a larger beat, accommodating greater bl ood pressure and circulating the blood faster. Starling's Law also states that if T grows too large, a catastrophic change occurs in the system.
Verify the Rybak experiment (that there is a heartbeat present at T=0) and Starling's law by analyzing th e behavior of the phase plane trajectories for the heartbeat equations as the tension T varies between T = 0 and T = (27*(b1)^2/4)^(1/2). What is the unique physiological condition present at T>(27*(b1)^2/4)^(1/2)? (Hint: For a heartbeat to be considere d "successful", electrochemical activity of the entire heartbeat must be greatest at systole.)
B. Analyze the effects of ê variations on an ECG. An ECG is an Electro Cardio Gram produced by plotting b vs. time. Notice the change in period and amplitude of the ECG. Is this consistent with your interpretation of ê from part A? Help on making DsTool produce an ECG.